Running a survey? Sooner or later you’re bound to draft a report based on the data you acquired. How to make your work on the report pleasant and the outcome useful, attractive, and engaging? Next time try the following :
Define the objective
At the very beginning of your report, describe to yourself and the readers the objective of the document you created. Remember about this objective at all times and try not to deviate from your goal and organize your document around it. This will help you achieve coherent communication and create the desired effect.
Narrate your story
If you want to engage your audience forget about the impact of data – give them a captivating story! Think of why you decided to conduct the research in the first place. You didn’t know how to reach your target group? Have you noticed a drop in the interest of a certain group of users? Your competition completely changed their tactics? Those details will surely grab the attention of your readers and help them engage in the issues you tackling. Try to describe your way of thinking that brought you to this place. Why did you conduct the research? What prompted you to choose online surveys and what effects do you expect from this report? Strive to make your communication direct and clear for all kinds of audience.
Focus on the specific details
If you don’t want your report to be average don’t describe average data. Information that is too general is rarely interesting. Focus on a specific section: people 55+ who opted for the competition; service users owning cats; loyal customers with mustaches; new clients favoring red color and married to women called Anna … see … now it gets interesting …
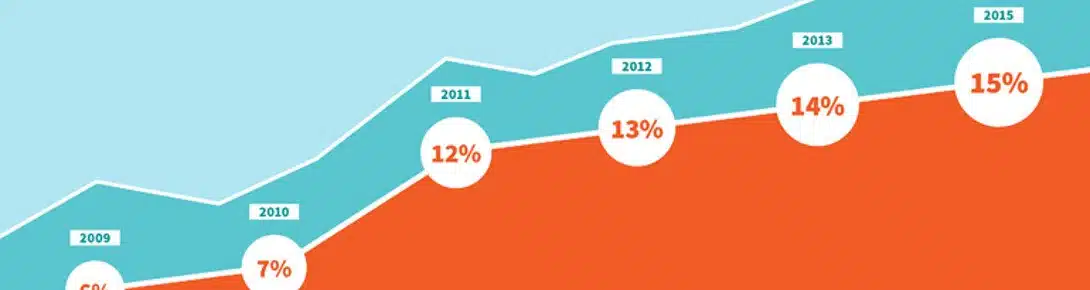
Visualize your data
Try to visualize your data whenever you can. Most people are visualizers and data presented in the form of a graph makes a bigger impression on them than plain numbers. Remember, you don’t have to limit yourself to graphs: use pictures, handmade sketches, tables, icons, and other possibilities. Graphic elements make your communication more attractive and easier to understand. Make sure, however, that all the visual elements are clear and coherent. You may want to use dedicated reporting tools such as e.g. dapresy.com. We’re optimizing SurveyLab to work smoothly with this popular service and soon our users will get additional, advanced reporting possibilities.
However, be careful! Don’t withdraw completely from numbers and descriptions. Repeat the most crucial data event several times in a different way. This is how you’ll make sure they reach your audience no matter if they really are visualizers or not.
Propose next steps
Can you draw conclusions for the future from the information you obtained? What are the market tendencies? What can be expected in the nearest or more distant future? Can anything be done to prevent it? How to use the upcoming opportunity?
Reach out to your audience
Invite your audience to the discussion. The easiest way to do it is by including open questions in your report. This might make them stop and think for a while about the issues you’re describing. Perhaps you’ll inspire them to dig deeper into the matter, receive answers to your questions, or make new, profitable business connections.
Provide sources
Always give sources for the data you’re referring to. They should be easily accessible and clearly visible, yet not too invasive or dominant. It’s a good idea to place them in footnotes at the bottom of each page or directly under the pictures. Your sources should be reliable. This will also boost your credibility.
Add an appendix
Your report is interesting and engaging but what about all the fascinating data you gathered and had to omit to achieve this? Don’t worry, they will fit perfectly in the appendix. They will be available for everyone truly interested in further details, and the report will gain even more credibility.
Request feedback
If you’re presenting the report yourself, simply ask your audience to write down their impressions about the information you’re providing on a piece of paper. If you’re distributing the document online, you may end it with a link to a feedback survey or just ask for a feedback email.